Trace the journey from manual spreadsheets to AI-powered reporting tools and understand how this evolution is transforming business intelligence.
The story of business reporting is one of continuous evolution, driven by the relentless pursuit of better insights, faster analysis, and more informed decision-making. From the humble beginnings of paper ledgers to today's sophisticated AI-powered platforms, each advancement has fundamentally changed how businesses understand and act upon their data.
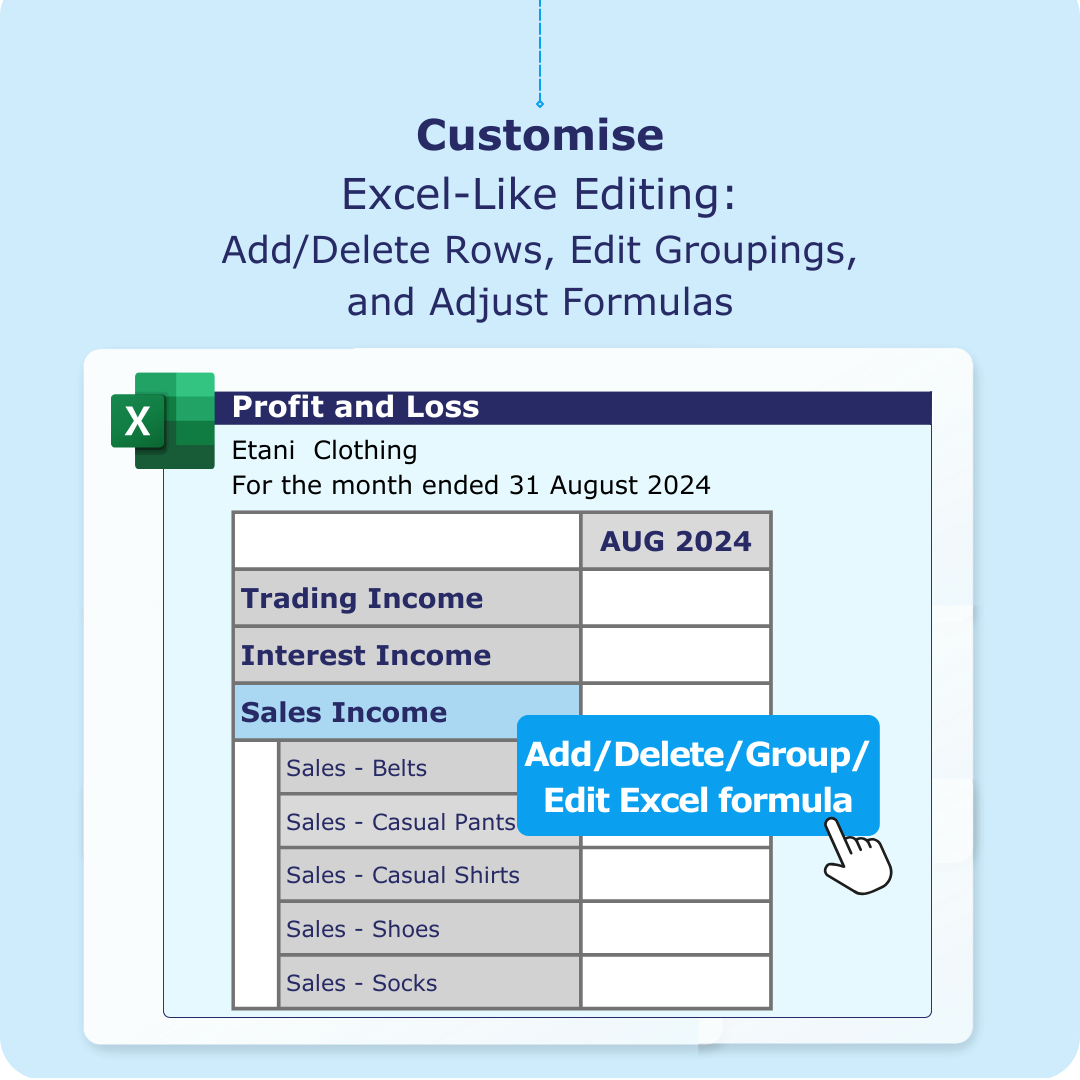
The introduction of electronic spreadsheets in the late 1970s, popularised by VisiCalc and later Microsoft Excel, revolutionised business reporting. For the first time, businesses could perform complex calculations, create dynamic models, and generate reports without manual computation.
Spreadsheets brought unprecedented flexibility to business reporting. Users could create custom formulas, build complex models, and visualise data through charts and graphs. The familiar grid interface made it accessible to non-technical users, democratising data analysis across organisations.
As businesses grew and data volumes increased, the limitations of spreadsheet-based reporting became apparent:
The 1990s and 2000s saw the emergence of dedicated Business Intelligence (BI) platforms designed to address the limitations of spreadsheet-based reporting. Tools like Cognos, BusinessObjects, and later Tableau and QlikView introduced new paradigms for data analysis and visualisation.
BI platforms introduced the concept of centralised data warehouses, where information from multiple sources could be consolidated, cleaned, and structured for analysis. This eliminated the need for manual data gathering and reduced inconsistencies across reports.
Moving beyond static reports, BI platforms offered interactive dashboards that allowed users to drill down into data, filter information, and explore different perspectives dynamically.
Tools like Tableau pioneered self-service analytics, empowering business users to create their own reports and visualisations without relying on IT departments.
Despite their advantages, traditional BI platforms introduced new challenges:
The 2010s brought cloud computing to the forefront, transforming how businesses approached reporting and analytics. Cloud-based platforms like Microsoft Power BI, Google Analytics, and Salesforce Analytics offered new possibilities for data access, collaboration, and scalability.
The latest evolution in reporting tools represents perhaps the most significant shift since the invention of spreadsheets: the integration of artificial intelligence and natural language processing into business reporting.
Instead of learning complex query languages or navigating intricate interfaces, users can simply ask questions in plain English: "Which products had the highest profit margins last quarter?" or "Show me customers at risk of churning."
AI systems can automatically identify patterns, anomalies, and trends in data, surfacing insights that might be missed by human analysts. This proactive approach to analytics helps businesses stay ahead of problems and opportunities.
Moving beyond historical reporting, AI-powered tools can forecast future trends, predict outcomes, and suggest optimal actions based on data patterns and machine learning algorithms.
Advanced AI systems understand business context, industry terminology, and user intent, providing more relevant and actionable insights than traditional reporting tools.
EVA (Enterprise Virtual Assistant) represents the culmination of this evolutionary journey, combining the best aspects of each previous generation while addressing their limitations:
This evolution from spreadsheets to AI has fundamentally changed how businesses make decisions:
Traditional reporting was largely reactive-showing what happened after the fact. AI-powered tools enable proactive decision-making by predicting future outcomes and suggesting preventive actions.
The democratisation of data analysis means that insights are no longer limited to technical specialists. Business users at all levels can access and interpret data without extensive training.
Monthly or quarterly reporting cycles have given way to continuous monitoring and real-time insights, enabling faster response to changing business conditions.
As we look to the future, several trends are shaping the next phase of reporting tool evolution:
AI will increasingly augment human decision-making by automatically preparing data, suggesting analyses, and highlighting important insights, allowing humans to focus on strategic thinking rather than data preparation.
Analytics capabilities will be embedded directly into business applications, making insights available at the point of decision without switching between different tools.
Future reporting tools will facilitate better collaboration between humans and AI, with systems learning from user interactions and becoming more valuable over time.
Understanding this evolutionary journey helps businesses make informed decisions about their reporting tools. While spreadsheets remain valuable for certain tasks, the complexity of modern business requires more sophisticated solutions.
The key is to choose tools that not only meet current needs but also position your organisation for future growth and changing requirements. AI-powered platforms like EVA represent the current state-of-the-art, offering the flexibility of spreadsheets, the power of BI platforms, the accessibility of cloud solutions, and the intelligence of artificial intelligence.
The evolution of reporting tools is far from over. As artificial intelligence continues to advance and new technologies emerge, we can expect even more dramatic changes in how businesses interact with their data. The organisations that embrace this evolution will be best positioned to thrive in an increasingly data-driven world.
Experience the future of reporting with EVA's AI-powered conversational analytics platform.
Start Your Evolution Today